Querying with QGreenland
These quick, one-page tutorials teach you how to analyze QGreenland datasets with beginner-level geoprocessing tools. Our tutorials walk you through the step-by-step process with easy-to-follow directions and screenshots.
Context for Use
These quick, one-page tutorials focus on how to analyze or ‘query’ QGreenland datasets using beginner-level geoprocessing tools. After completing these tutorials students will understand how to 1) calculate the volume of the Greenland ice sheet, 2) select populated places in Greenland with more than 5,000 people, and 3) calculate the total population of Greenland’s towns and settlements. However, these tutorials are designed to introduce users to interacting with the QGreenland data package more broadly – and skills gained in these tutorials are transferrable to exploring other data within it, too. These tutorials span 15-20 minutes each and are best suited for beginner QGIS users.
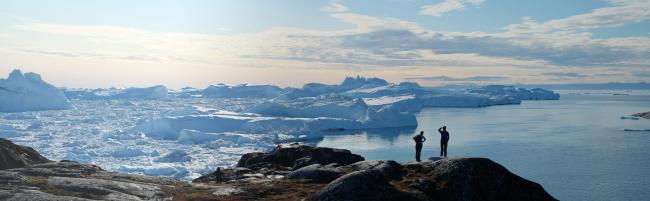
Scenic landscape of the Greenland ice sheets.




Goals Header
Learning Goals and Outcomes
Students will explore the following questions...
- What is a good estimate of the volume of the Greenland ice sheet?
- They will then calculate the volume of the Greenland Ice sheet.
- Which populated regions in Greenland have more than 5000 people?
- They will then select populated places in Greenland with more than 5000 people.
- What is the total number of people in Greenland’s populated areas? What is the average size of Greenland’s populated areas?
- They will then calculate the total population of Greenland’s towns and settlements.