Data Analysis: Introduction to Measurement, Error, and Outliers
In this lesson, students measure and compare the rate of a falling object (a penny) at different heights to learn about statistical error.
Context for Use
Project EXTREMES lessons were intended to be stand alone lessons.

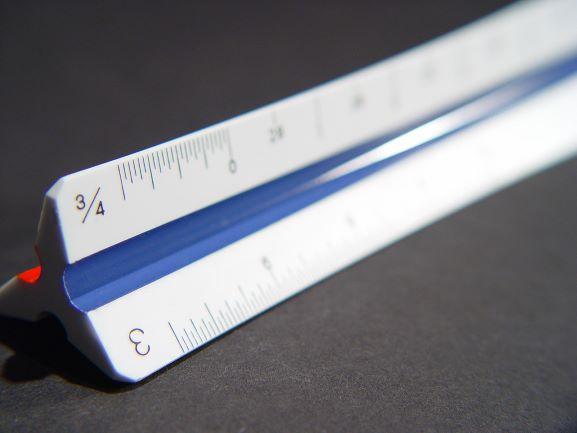
Scale Ruler Photo credit: filmingilman
Goals Header
What Students Will Do
Students will be able to define and apply the statistical concepts of measurement, error, and outliers.
Materials
User note: To make an editable copy of the teaching materials in Google Drive, select File > “Make a copy”. This will make a copy for you to save to your own drive and edit as you see fit.
Description
Part 1 – Engagement & Exploration (15 minutes) Errors in Data Collection
Students collect and share data to explore the quality of their data and learn about error in data collection.
Part 2 – Explanation (15 minutes) Variation in Data Collection
Students continue the exploration of the concept of variation in data.
Part 3 – Elaboration & Evaluation (15 minutes) Penny Drop Data Analysis
Students decide on a method to analyze class data and explain why. They discuss the different types of error in data collection.


