Data Puzzle: Not All Warming is Equal
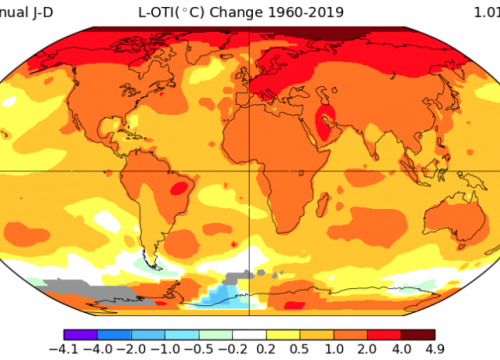
The increase in atmospheric carbon dioxide has caused global temperatures to rise by more than 1.1°C (~2°F). While global temperatures continue to rise, not all warming is equal as some parts of the world have seen temperatures increase by much more than the global average. Do the places on Earth where temperatures are increasing the most also have the greatest increases in atmospheric carbon dioxide?
Context for Use
This Data Puzzle is part of a larger collection of Data Puzzle resources that combine classroom-friendly datasets with Ambitious Science Teaching practices to help students make sense of phenomena
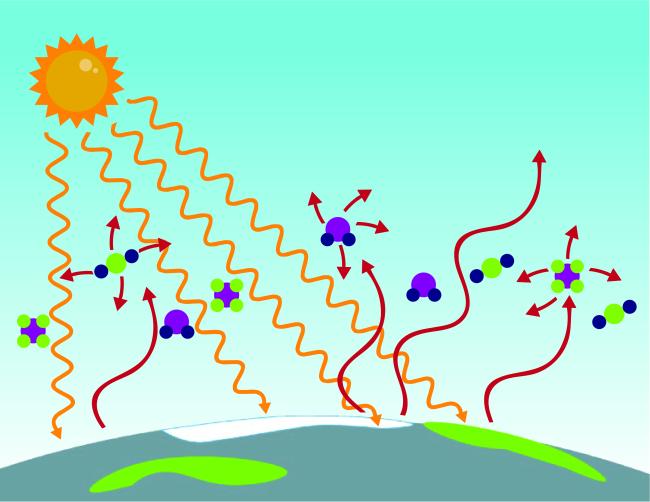
Greenhouse Effect
Goals Header
What Students Will Do
- Analyze and interpret global temperature and carbon dioxide data to determine which parts of Earth are experiencing the greatest changes in temperature and carbon dioxide.
- Construct a model to explain how the places on Earth where atmospheric CO2 is increasing the most are different from the places that are experiencing the greatest rise in temperatures.
Teaching Materials
Description
Part 1 (15 minutes) Eliciting Students' Ideas
- Students engage in a "think-pair-share" discussion activity related to the opening scenario prompt, "Think of a time when you were outside on a really hot summer day. Maybe you were playing in your backyard, walking the dog, or shooting hoops…Imagine the outdoor thermometer says 100°F, but is it really 100°F everywhere? Are there some places outside that might be hotter than others?"
- Teacher will use student ideas and information from the slide deck to make connections to the featured scientists work studying whether there is a connection between the places on Earth warming the fastest and the places where atmospheric CO2 concentrations are increasing the fastest.
Part 2 (45 minutes) Identifying Important Science Ideas
- Students engage with an interactive reading to 1) identify similarities between the opening scenario prompt and the work for Dr. Jen Kay, a climate scientist who studies the factors, including atmospheric greenhouse gases, that contribute to the rise in global temperatures; 2) make predictions as it relates to the investigative question, "Do the places on Earth where temperatures are increasing the most also have the greatest increases in atmospheric carbon dioxide?"
Part 3 (30 minutes) Supporting Ongoing Changes in Thinking
- Students test/compare their current understandings of the featured scientist’s research against authentic data.
Part 4 (30 minutes) Constructing Evidence-Based Explanations
- Students reflect on evidence gathered in parts 1-3 to construct a final explanatory model for the investigative question, "Do the places on Earth where temperatures are increasing the most also have the greatest increases in atmospheric carbon dioxide?"


