Data Puzzle: Wind Farms of the Future
The rise in atmospheric carbon dioxide, the result of humans burning fossil fuels, is causing the rise in global temperatures. To stop or slow this trend, we must transition to renewable energy (e.g., wind, solar). But where should these renewables be constructed? Dr. Julie Lundquist, an atmospheric scientist at the University of Colorado Boulder, studies wind and the energy that can be produced by wind turbines. Understanding wind patterns related to surface roughness and wind speeds (parameters featured in this Data Puzzle) across the United States allows scientists, engineers, and technicians to identify ideal locations for constructing wind turbines and help the United States and countries around the world meet their goals for reducing carbon dioxide emissions.
Context for Use
This Data Puzzle is part of a larger collection of Data Puzzle resources that combine classroom-friendly datasets with Ambitious Science Teaching practices to help students make sense of phenomena!

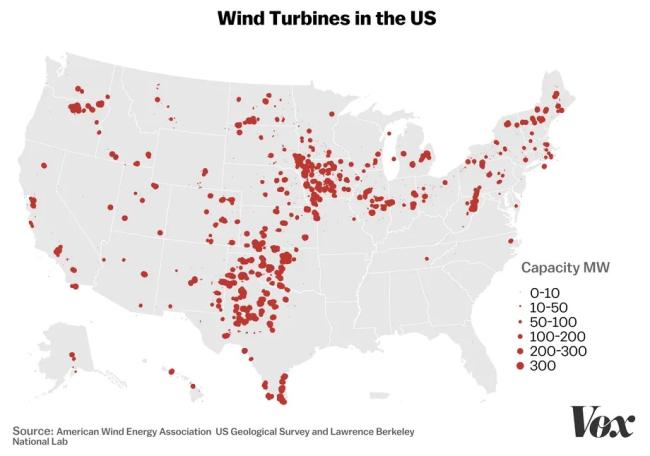
Wind farms across the United States (image from Vox)
Goals Header
What Students Will Do
- Analyze and interpret patterns in surface roughness and wind speed across the United States to identify suitable locations for the construction of future wind farms.
- Construct an explanation for where future wind farms could be constructed to generate the most energy.
Teaching Materials
Description
Day 1
Part 1 (20 minutes) Eliciting Students' Ideas
- Students engage in a whole-class discussion related to the opening scenario prompt(s), “What is the windiest day you’ve ever experienced? Where were you? Is it usually windy there? What did you do?”.
Part 2 (40 minutes) Identifying Important Science Ideas
- Students engage with an interactive reading to 1) identify similarities between the opening scenario prompt and the work of atmospheric scientist Julie Lundquist, an atmospheric scientist who studies to the relationship between surface roughness and wind speeds, and 2) make predictions as it relates to the investigative question, "Where in the United States (lands and/or waters) should new wind turbines be constructed to generate the most energy?"
Day 2
Part 3 (30 minutes) Supporting Ongoing Changes in Thinking
- Students test their prediction about the relationship between surface roughness and wind speed by analyzing datasets from across the United States (lands and waters).
Part 4 (30 minutes) Constructing Evidence-Based Explanations
- Students reflect on evidence gathered during parts 1-3 and construct a newspaper article to address the following prompt: "Imagine that you are part of a scientist Julie Lundquist's research team and a science journal has asked you to write an article about the future of wind farms. Tell your readers about how changes in surface roughness impact wind speeds across the United States. Based on what you have learned, explain where you think future wind farms should be constructed.


