Vegetation - Seasons from Space
Plants tell the story of the seasons, and satellites capture it all from space! In this lesson, students will compare vegetation maps from March and September, revealing striking seasonal differences. This opens the door to discussions about opposite seasons in different hemispheres and what happens during equinox periods.
Context for Use
In this short activity, students will strengthen their critical thinking skills by carefully observing the data, forming ideas, and backing them up with evidence.
While the main goal is to encourage slow, careful observation, this activity also connects to topics like seasons, vegetation cycles, photosynthesis, remote sensing, and climate zones. If you’re covering any of these, this could be a great addition to your unit!
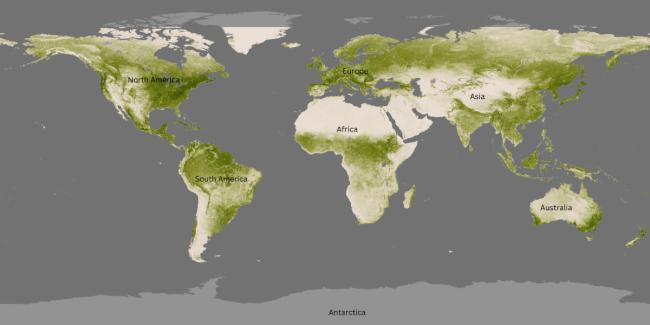
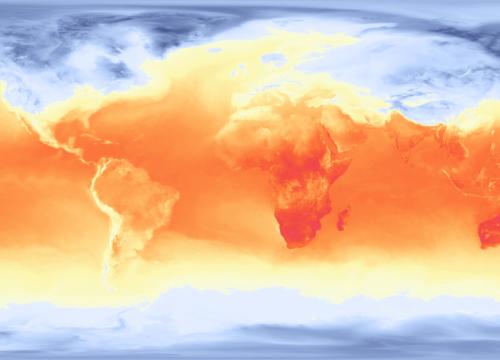
2016 Global Vegetation Index from NOAA-20's Visible Infrared Imaging Radiometer Suite (VIIRS).
Goals Header
What Students Will Do
- Students will strengthen their critical thinking skills by carefully observing the data, forming ideas, and backing them up with evidence.
Teaching Materials
Description
Time required: 10-20 minutes
