From Greenland to our Coasts: Exploring Sea Level Change with QGreenland
An understanding of Arctic regions, which are warming faster than the rest of the world, is crucial for understanding the global climate system. Greenland with its large ice sheet is of particular global importance and vulnerable to a changing climate, but the scale of the landforms can be difficult to grasp. Geographic Information Systems (GIS) can help students visualize and engage with Greenland data to answer questions about its influence on global climate systems in a concrete way. QGreenland is a free data environment that provides Greenland-focused data for use with the free, open-source QGIS software, and is supported by comprehensive tutorials and how-tos.
Context for Use
In this unit, students will explore how the Greenland Ice Sheet is changing and why that affects coastal communities worldwide. Students will view authentic Greenland geospatial data and learn how to create flood maps to assess local risk in QGIS.
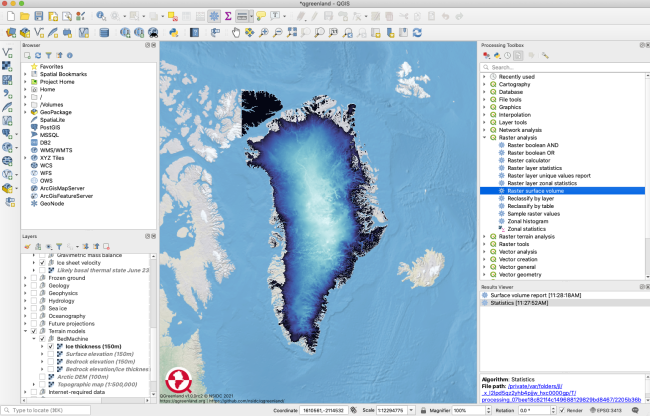
QGreenland GIS screen capture


Goals Header
What Students Will Do
Lesson 1 - Ice Sheet Loss
- Develop an initial claim to describe how the Greenland Ice Sheet is changing.
- Analyze geospatial data to provide evidence for the magnitude of glacial retreat of the Greenland Ice Sheet.
Lesson 2 - Sea Level Rising
- Use mathematical thinking to calculate the contribution of a retreating Greenland Ice Sheet melting on sea-level rise
Lesson 3 - Flood Map
- Obtain, evaluate, and communicate the risks associated with sea-level rise by creating a flood map