Background:
Atmospheric (air) pressure refers to the pressure exerted against a surface by the weight of the atmosphere above. Air pressure varies day to day at the Earth’s surface due to unequal heating by the Sun and other processes. Areas where the air is warmed often have low pressure because warm air rises, and thus there is less downward pressure exerted on the surface. In contrast, areas where the air is cooled often have high pressure because cold air sinks, resulting in more downward pressure exerted on the surface.
Low pressure systems have a lower pressure at their center relative to the areas around it. As a result, winds blow towards the low pressure center (air moves from high to low pressure to reach equilibrium), and rises into the atmosphere (Figure 1). Water vapor in this rising air mass condenses, forming clouds and increasing the chance of precipitation. Low pressure systems are often associated with storms.
In contrast, high pressure systems have a higher pressure at their center relative to the areas around it. As a result, winds blow away from the high pressure center. Air from the atmosphere above sinks down into the space left behind by the air blown outward (Figure 1). High pressure systems are often associated with calmer weather.

Figure 1. Air moves down away from high pressure systems (left) and air moves up and condenses in low pressure systems (right).
Instructions:
Meteorological data, including atmospheric pressure and air temperature, presented in this assessment were collected by instruments (Figure 2) adjacent to the Polarstern during Leg 1 of the MOSAiC expedition. Refer to the atmospheric pressure (Figure 3) and air temperature (Figure 4) datasets and what you know about high and low pressure systems to answer questions in the following quiz.
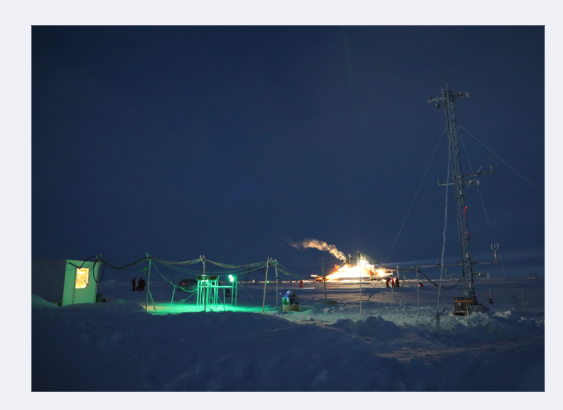
Figure 2. Meteorological data presented in this assessment were collected by instruments like this 10 meter tall tower (right) deployed on the sea ice adjacent to the Polarstern (lit up in the background). Photo Credit: Matthew Shupe

Figure 2. Meteorological data presented in this assessment were collected by instruments like this 10 meter tall tower (right) deployed on the sea ice adjacent to the Polarstern (lit up in the background). Photo Credit: Matthew Shupe

Figure 4. This figure displays atmospheric pressure (blue) and air temperature (orange) over time during the Leg 1 of the MOSAiC expedition.
MOSAiC Connection:
On November 16th, 2019 a storm rolled into the location of the Polarstern, bringing with it winds of up to 20 m/s (almost 45 mph). The storm caused new cracks to form in the ice floe, and a lead (large fractures in the ice exposing the water underneath - see Figure 5 and in the gift that is uploaded as a "Sea Ice Movement" video in the atmosphere module) opened up between the ship and three of the science sites (MET City, ROV Oasis, and the Remote Sensing Site) distributed around the ship, resulting in these sites drifting towards the port side of the ship. Some sites were relocated (Figure 6), and the science city layout had to be remapped. An important component of doing research in such a remote, rugged, and dynamic environment is being able to respond to unexpected changes in the environment and to adapt on the fly.

Figure 5. Radar image capture sea ice movement and deformation in the region around the Polarstern (red circle) from November 17, 2019. GIF Credit: DLR, TSX/TDX AO: suman_OCE3562. The Full animation of the sea ice movement for the time period of from 25/9/19 through 12/12/19 is available in the following video item, "Sea Ice Movement". You'll need to watch the gif before answering question 11 in the Atmosphere quiz!

Figure 6. After the storm, MOSAiC scientists built a bridge across a lead that opened between Ocean City and the Remote Sensing Site. Photo Credit: Stefan Hendricks