Lesson Plans & Activities
Data Puzzle: Weather vs. Climate - Extreme Cold in a Warming World?
This data puzzle is a stand-alone lesson that is part of a larger collection of data puzzles.
In this Data Puzzle, students explore the difference between weather and climate in the context of an extreme cold event that occurred during a NFL playoff game between the Kansas City Chiefs and Miami Dolphins on January 13th, 2024. The air temperature at kickoff was -4°F, making it the fourth coldest NFL game ever played! But what does this cold weather event tell us (if anything) in the context of long-term average temperature patterns in the region?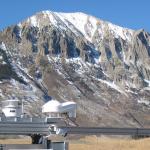
Data Puzzle: Snow in the Rockies
This data puzzle is a stand-alone lesson that is part of a larger collection of data puzzles.
Water from snowmelt high in the Rocky Mountains feeds into the Colorado River, a river system that more than 40 million people rely on for water. In this Data Puzzle, students analyze snowfall and snowmelt datasets to investigate the question, "How have snow conditions in the East River Watershed changed over time?"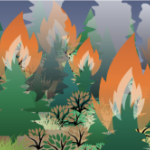
Data Puzzle: Wildfire, Drought, and the Future of Forests
This data puzzle is a stand-alone lesson that is part of a larger collection of data puzzles.
Wildfires are burning more and more of the forests across the western United States. In this Data Puzzle, Data Puzzle, students analyze post-fire forest recovery datasets as they gather evidence to construct explanatory models for the following question, "How do climate conditions impact the recovery of forests after a wildfire?"
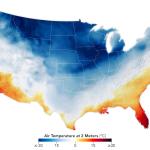
Data Puzzle: Not All Warming is Equal
This data puzzle is a stand-alone lesson that is part of a larger collection of data puzzles.
The dramatic increase in atmospheric carbon dioxide has caused global temperatures to rise by more than 1.1°C (~2°F), but not all warming is equal. In this Data Puzzle, students analyze temperature and atmospheric carbon dioxide datasets to construct explanatory models for the following question, "Do the places on Earth where temperatures are increasing the most also have the greatest increases in atmospheric carbon dioxide?"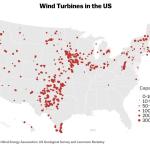
Data Puzzle: Wind Farms of the Future
This data puzzle is a stand-alone lesson that is part of a larger collection of data puzzles.
Transitioning from fossil fuels to clean, renewable energy sources like wind is essential if the US is to reduce its carbon emissions. But where should new wind farms be constructed? In this Data Puzzle, students analyze surface roughness and wind speed data to construct an evidence-based explanation for the following question, "Where in the United States (lands and waters) should new wind turbines be constructed to generate the most energy?"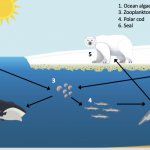
Data Puzzle: Tracing Carbon Through the Arctic Food Web
This data puzzle is a stand-alone lesson that is part of a larger collection of data puzzles.
The Arctic is home to a huge variety of living things (humans included) that have adapted to harsh conditions. However, these conditions are changing as Arctic temperatures rise and sea ice declines. In this Data Puzzle, students trace the flow of carbon through the Arctic food web to construct explanatory models for the following question, "How might the decline in sea ice affect Arctic organisms large and small?"

Data Puzzle: The Tipping Point
This data puzzle is a stand-alone lesson that is part of a larger collection of data puzzles.
Plants like moss campion are uniquely adapted to the cold, dry climate characteristic of the tundra biome...but temperatures are on the rise. In this Data Puzzle, students analyze temperature and reproduction data to construct explanatory models for the following question "How is moss campion reproduction affected by temperature?"
Data Puzzle: Megadrought in the Colorado River Basin
This data puzzle is a stand-alone lesson that is part of a larger collection of data puzzles.
Much of the western United States is experiencing drought conditions. In this Data Puzzle, students analyze authentic climate data to construct explanatory models for the following question, "What is causing the megadrought in the Colorado River Basin?"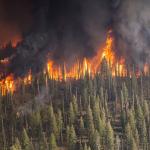
Data Puzzle: Megafire - Rare Occurrences or the New Normal?
This data puzzle is a stand-alone lesson that is part of a larger collection of data puzzles.
Megafires have been a hot topic in the news over the past few years, but are they a new phenomenon? In this Data Puzzle, students analyze authentic wildfire data to construct explanatory models for the follow question, "How and why has the number of megafires have changed over time?"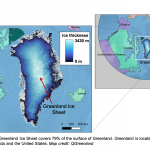
Data Puzzle: Balancing Act
This data puzzle is a stand-alone lesson that is part of a larger collection of data puzzles.
Since the early 2000s, the Greenland Ice Sheet’s mass balance has been consistently negative, meaning more mass is being lost than gained. But this change in mass balance hasn’t always happened at the same rate. What could account for observed changes to the amount of ice in the Greenland Ice Sheet in recent decades?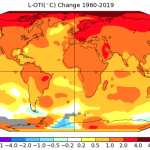
Data Puzzle: On a Budget
This data puzzle is a stand-alone lesson that is part of a larger collection of data puzzles.
The Arctic is currently warming at a rate faster than the global average, a phenomenon known as Arctic amplification. In this Data Puzzle, students analyze authentic Arctic datasets to construct explanatory models for the following question, "Why might the Arctic be warming faster than other places on Earth?"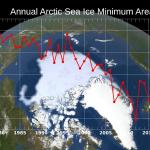
Data Puzzle: To Reflect or Not to Reflect
This data puzzle is a stand-alone lesson that is part of a larger collection of data puzzles.
The color of Earth's surface determines how much of the Sun's energy is reflected or absorbed, where lighter-colored surfaces are more reflective (higher albedo). In this Data Puzzle, students analyze authentic Arctic data to construct explanatory models for the following question, "How might the Arctic’s albedo be affected by the observed decline in sea ice?"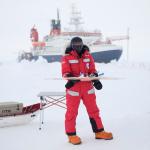
Data Puzzle: It's All Connected
This data puzzle is a stand-alone lesson that is part of a larger collection of data puzzles.
What makes the Arctic climate system so unique is the sea ice, which influences the Arctic climate in many ways. In this Data Puzzle, students analyze authentic Arctic data to construct explanatory models for the following question, "What effect, if any, do leads (cracks in the sea ice) have on the transfer of moisture between the Arctic Ocean and atmosphere?"