Lesson Plans & Activities
Data Puzzle: Windstorms on the Front Range
Although strong windstorms are a common weather event at the foot of the Rocky Mountains, a record-breaking windy spring soon after the Marshall Fire disaster had the public feeling on-edge. In this Data Puzzle, students analyze data on the number of windstorms and the number of red flag warnings to investigate the question, “Is it getting windier on the Front Range as the climate warms?”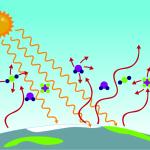
Data Puzzle: Not All Warming is Equal
This data puzzle is a stand-alone lesson that is part of a larger collection of data puzzles.
The dramatic increase in atmospheric carbon dioxide has caused global temperatures to rise by more than 1.1°C (~2°F), but not all warming is equal. In this Data Puzzle, students analyze temperature and atmospheric carbon dioxide datasets to construct explanatory models for the following question, "Do the places on Earth where temperatures are increasing the most also have the greatest increases in atmospheric carbon dioxide?"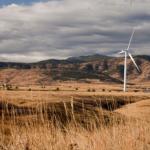
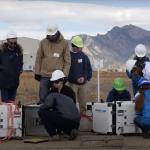
Shifting Winds
In this short unit, students investigate the question "Are wind patterns at the foot of the Rocky Mountains changing?" Students explore what causes wind and look at recent wind data. Students create a public-facing infographic to explain to the public if and how wind patterns are changing.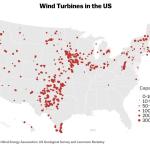
Data Puzzle: Wind Farms of the Future
This data puzzle is a stand-alone lesson that is part of a larger collection of data puzzles.
Transitioning from fossil fuels to clean, renewable energy sources like wind is essential if the US is to reduce its carbon emissions. But where should new wind farms be constructed? In this Data Puzzle, students analyze surface roughness and wind speed data to construct an evidence-based explanation for the following question, "Where in the United States (lands and waters) should new wind turbines be constructed to generate the most energy?"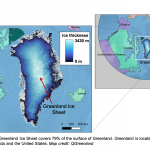
Data Puzzle: Balancing Act
This data puzzle is a stand-alone lesson that is part of a larger collection of data puzzles.
Since the early 2000s, the Greenland Ice Sheet’s mass balance has been consistently negative, meaning more mass is being lost than gained. But this change in mass balance hasn’t always happened at the same rate. What could account for observed changes to the amount of ice in the Greenland Ice Sheet in recent decades?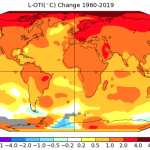
Data Puzzle: On a Budget
This data puzzle is a stand-alone lesson that is part of a larger collection of data puzzles.
The Arctic is currently warming at a rate faster than the global average, a phenomenon known as Arctic amplification. In this Data Puzzle, students analyze authentic Arctic datasets to construct explanatory models for the following question, "Why might the Arctic be warming faster than other places on Earth?"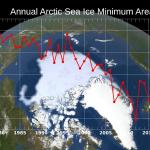
Data Puzzle: To Reflect or Not to Reflect
This data puzzle is a stand-alone lesson that is part of a larger collection of data puzzles.
The color of Earth's surface determines how much of the Sun's energy is reflected or absorbed, where lighter-colored surfaces are more reflective (higher albedo). In this Data Puzzle, students analyze authentic Arctic data to construct explanatory models for the following question, "How might the Arctic’s albedo be affected by the observed decline in sea ice?"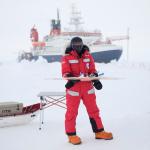
Data Puzzle: It's All Connected
This data puzzle is a stand-alone lesson that is part of a larger collection of data puzzles.
What makes the Arctic climate system so unique is the sea ice, which influences the Arctic climate in many ways. In this Data Puzzle, students analyze authentic Arctic data to construct explanatory models for the following question, "What effect, if any, do leads (cracks in the sea ice) have on the transfer of moisture between the Arctic Ocean and atmosphere?"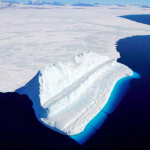
Human Impacts on Climate Change: What will happen and what can we do about it?
This is the fifth lesson of a five-part curriculum about Antarctic physical environments and ecosystems.
In this lesson, students explore how human activities will continue to impact Antarctic ice, discuss human contributions to climate change, and investigate what we can do to stop/reverse these negative effects.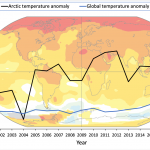
Arctic Feedbacks: Not All Warming Is Equal
This storyline unit consists of 10 lessons, each tied to NGSS Earth's systems standards
In this MS/HS unit, students engage with 360° virtual field trips, authentic Arctic datasets, and app-based labs to construct models and explanations for the unit driving question, "Why might the Arctic be warming four times as fast as the rest of the world?"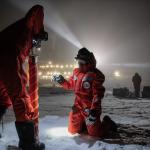
Exploring the New and Old Arctic
This unit consists of 6 lessons, each tied to NGSS nature of science understandings
In this MS/HS unit, students compare and contrast Arctic expeditions of the past (1893-1896 Fram expedition) and the present (2019-2020 MOSAiC expedition) to prepare for the Arctic of the future.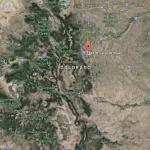
Why Are Cities and Other Regions of the World Getting Hotter?
This is the third lesson in the Climate Resiliency Education High School Climate Unit.
This lesson has students investigate how albedo is contributing to temperature increasing in some places, like cities, are increasing at faster rates than elsewhere.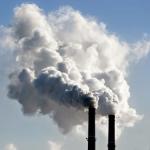
How Do Humans Contribute to the Increase in Global Temperatures?
This is the fourth lesson in the Climate Resiliency Education High School Climate Unit.
Students explore the greenhouse effect in this lesson using a computer simulation and develop a model for how it works.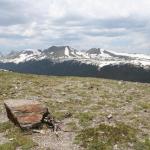
Arctic Climate Connections
The Broader Impacts portion of the NSF proposal studies the analysis of existing data from Arctic terrestrial stations with multi-year measurements of the surface energy budget, clouds, soil temperature profiles, and basic meteorological measurements.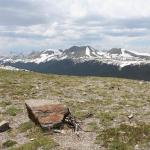
Exploring the Arctic
This is the first activity of a three-part curriculum about Arctic climate; the activities may be used independently or in sequence.
This activity introduces students to the Arctic and Arctic climate. Through a virtual exploration of the geography of the Arctic students become familiar with the region. They are then introduced to meteorological parameters that Arctic research teams use.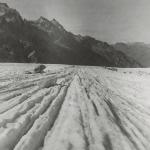
Exploring Arctic Climate Data
This is the third activity of a three-part curriculum about Arctic climate; the activities may be used independently or in sequence.
In this final activity, students use authentic Arctic climate data to explore albedo and its relationship to seasonal snowmelt as a self-reinforcing feedback mechanism, which is then applied to large scale global climate change.
Do you really want to visit the Arctic?
This is the second activity of a three-part curriculum about Arctic climate; the activities may be used independently or in sequence.
This jigsaw activity introduces students with Arctic weather data using a role-playing activity that has students read and interpret graphs while considering the optimal time to plan a research mission to the Arctic.