Carbon Dioxide Visuals
In this lesson, students will slowly observe a carbon cycle diagram and a map of carbon dioxide in the atmosphere. In addition, students will complete a carbon dioxide data jigsaw puzzle using different types of data visualizations.
Context for Use
In this short activity, students will strengthen their critical thinking skills by carefully observing the data, forming ideas, and backing them up with evidence.
While these maps connect to lessons on carbon dioxide, the carbon cycle, and global emissions, the main focus is on slowing down, looking closely, asking great questions, and building stronger evidence-based ideas. If you’re teaching any of these topics, this activity could be a valuable addition to your unit!

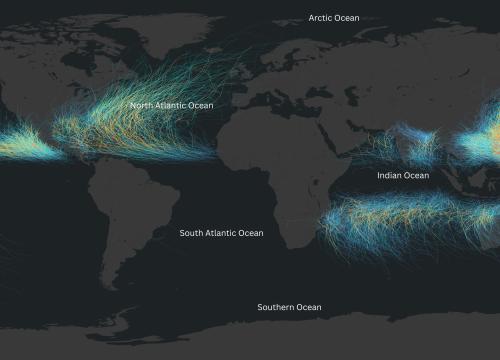
Global map visualization showing atmospheric carbon monoxide concentrations on November 30, 2006, with high levels in red across the Northern Hemisphere and lower concentrations in blue and green near the equator and Southern Hemisphere. Country labels overlay the map for geographic reference.


Goals Header
What Students Will Do
- Students will slowly observe a carbon cycle diagram and a map of carbon dioxide in the atmosphere.
- Students will complete a carbon dioxide data jigsaw puzzle using different types of data visualizations.
Teaching Materials
Description
Time required: 30 minutes