Introduction to Point Data in QGIS
In this lesson, students will learn foundational skills for viewing and editing geospatial data using real-world examples. Using the colony locations of the thick-billed murre, a culturally important arctic bird, students will learn how to view point data, access and interpret the attribute table, and add new data points with attributes.
Context for Use
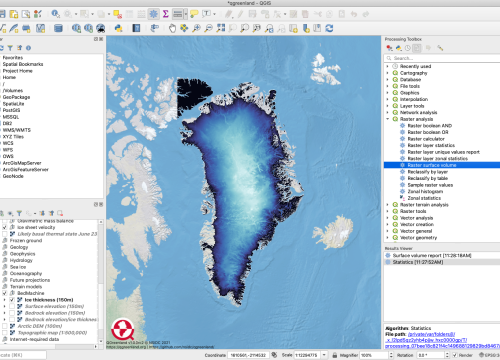
This lesson introduces foundational skills for viewing and editing geospatial data using real-world examples. Through using the QGreenland data package students will learn how to view point data, access and interpret a vector attribute table, and create new data by adding a point in QGIS. This activity spans a total of 60 minutes, which can act as a two-part stand-alone lesson, and is best suited for use in middle or high school classes or as a singular introductory activity in a more comprehensive GIS class in an undergraduate setting.

Two Thick-billed Murres on a rock. Credit: Art Sowles, US Fish and Wildlife



Goals Header
Learning Goals and Outcomes
Students will...
- Understand that data visualization helps people interpret the past and present.
- Develop an initial model that describes Thick-billed Murre data from Greenland.
- Be able to: Turn data layers on/off, access and interpret a vector attribute table, and create new data by adding a point.