Drought Data Indicators
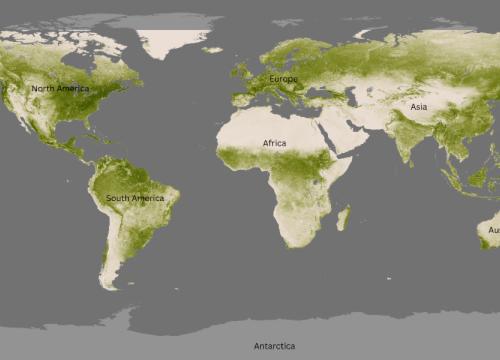
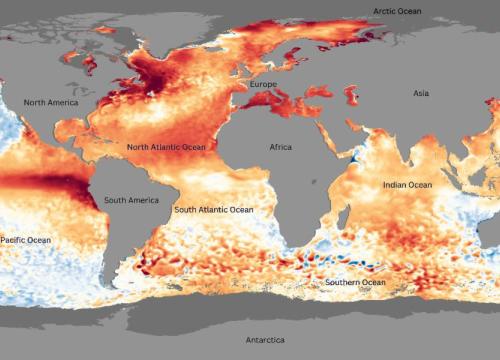
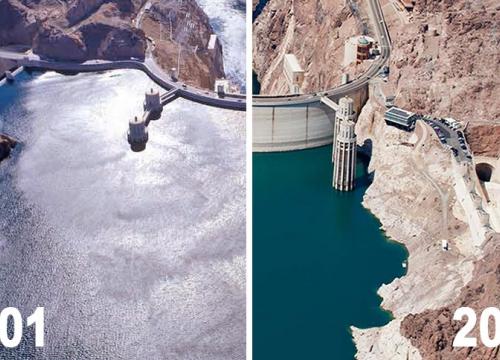
In this lesson, students will begin by observing a 1935 illustration of a drought scene and a global drought risk dataset. Following this, they will compare satellite data with information from the U.S. Drought Monitor, which integrates local climate and agricultural data.
Context for Use
In this short activity, students will strengthen their critical thinking skills by carefully observing the data, forming ideas, and backing them up with evidence.
While these maps connect to lessons on drought, climate, weather, and natural and human impact hazards, the primary focus is on slowing down, looking closely, asking great questions, and building stronger evidence-based ideas.
If you are teaching any of these topics, this activity could be a valuable addition to your unit.

U.S. Drought Monitor Map



Goals Header
What Students Will Do
- Students will strengthen their critical thinking skills by carefully observing the data, forming ideas, and backing them up with evidence
Teaching Materials
Description
Time required: 30 minutes